

Privacy token ZEC has emerged as one of today’s strongest performers, surging 16% in the past 24 hours to hit a nine-month high at press time.
The rally comes as the broader crypto market rebounds following a subdued weekend. ZEC could extend its gains with traders rotating back into altcoins showing fresh momentum.
Sponsored
ZEC Rally Gains Strength
Technical indicators suggest that ZEC’s rally may have further room to run. One crucial indicator is the Moving Average Convergence Divergence (MACD), which provides insights into price trends and momentum. Currently, the MACD line (blue) sits above the signal line (orange), indicating substantial bullish sentiment among market participants.
This positioning suggests that traders are focusing on accumulation rather than distribution, reinforcing the ongoing strength in ZEC’s performance. The latest setup indicates that the bulls are in control, and buying momentum may continue to strengthen in the near term.
The MACD is a widely used tool among traders for identifying potential buy or sell signals through crossovers between its two lines. A crossover where the MACD line rises above the signal line suggests increasing buying momentum and reinforces the current bullish phase. Conversely, when it crosses below, it typically indicates potential downward pressure on the asset.
For ZEC, the current MACD positioning reflects strong conviction behind its rally, heightening expectations of possible further gains if bullish sentiment remains prevalent in the market.
Additionally, ZEC’s Aroon Up Line has recently reached 100%. This level hints at a robust and ongoing uptrend, further bolstering the bullish outlook.
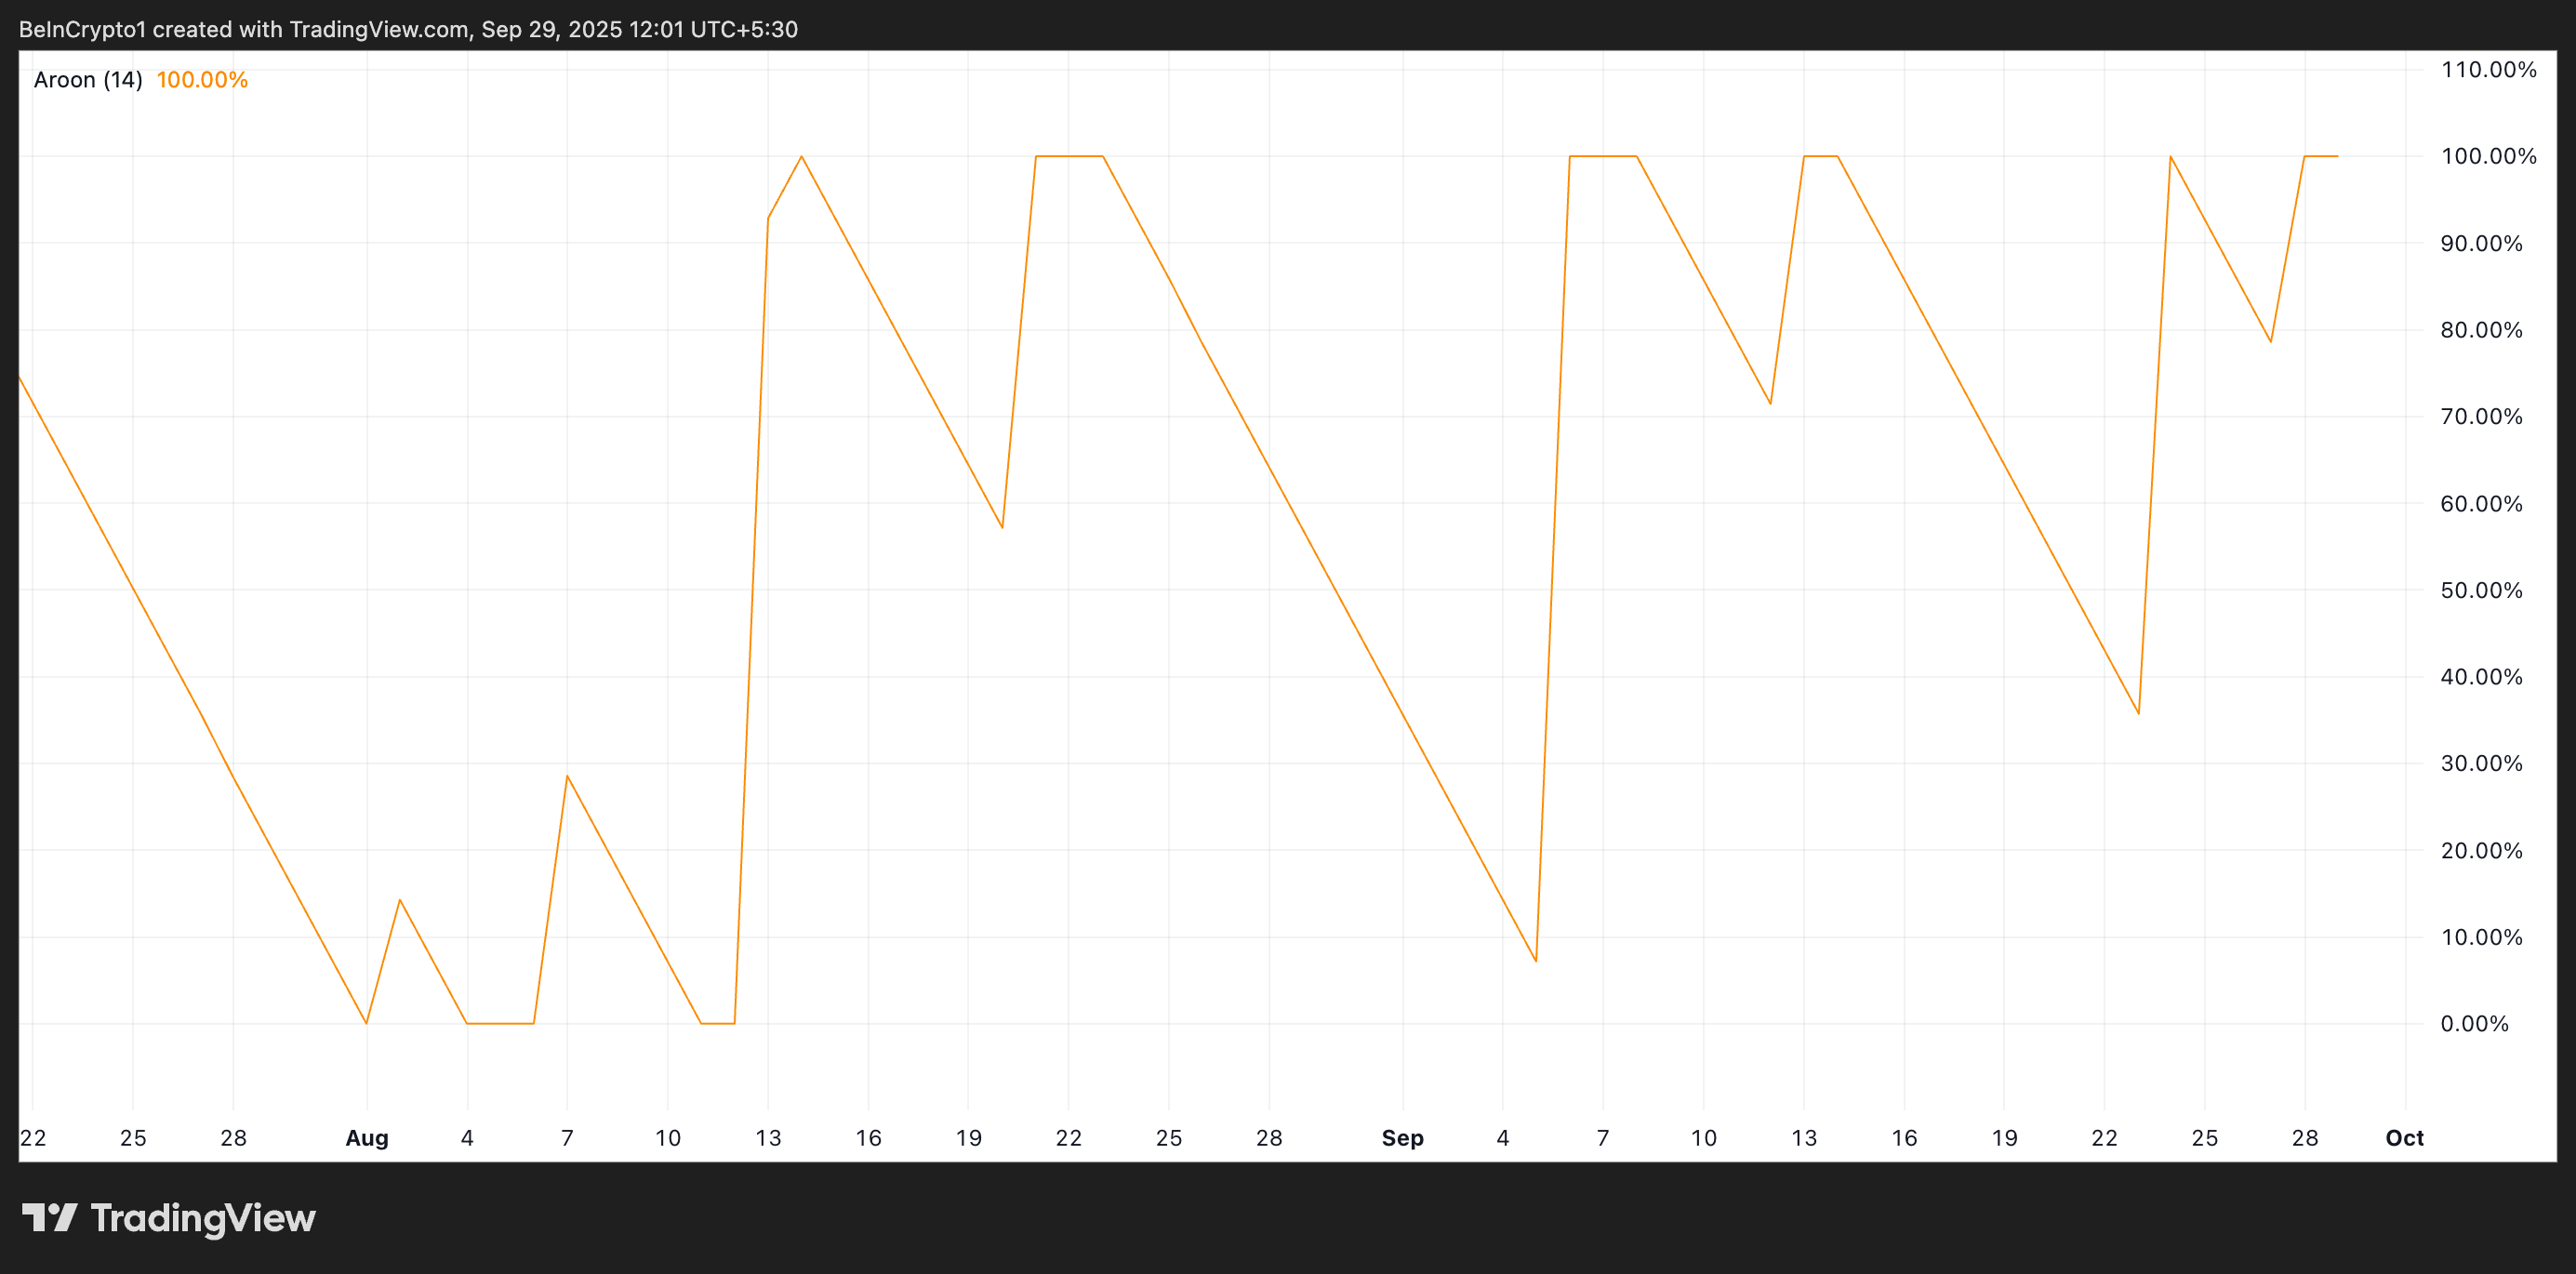
The Aroon indicator plays a vital role in assessing the strength and direction of a trend. It analyzes the time elapsed since an asset’s recent highs and lows. An increasing Aroon Up Line signals that the price is consistently hitting new highs, affirming bullish momentum and the likelihood of an enduring uptrend. ZEC’s recent performance aligns with this interpretation, trading near levels last observed in December 2024 and gaining support from bullish market dynamics.
Zcash Trades Near Breakout Zone
At the time of writing, ZEC is trading around $63.92, just below a significant resistance level of $68.04. Should buying pressure persist, there’s potential for ZEC to breach this resistance, transforming it into a support floor. This breakout could set the stage for a climb toward $79.33.
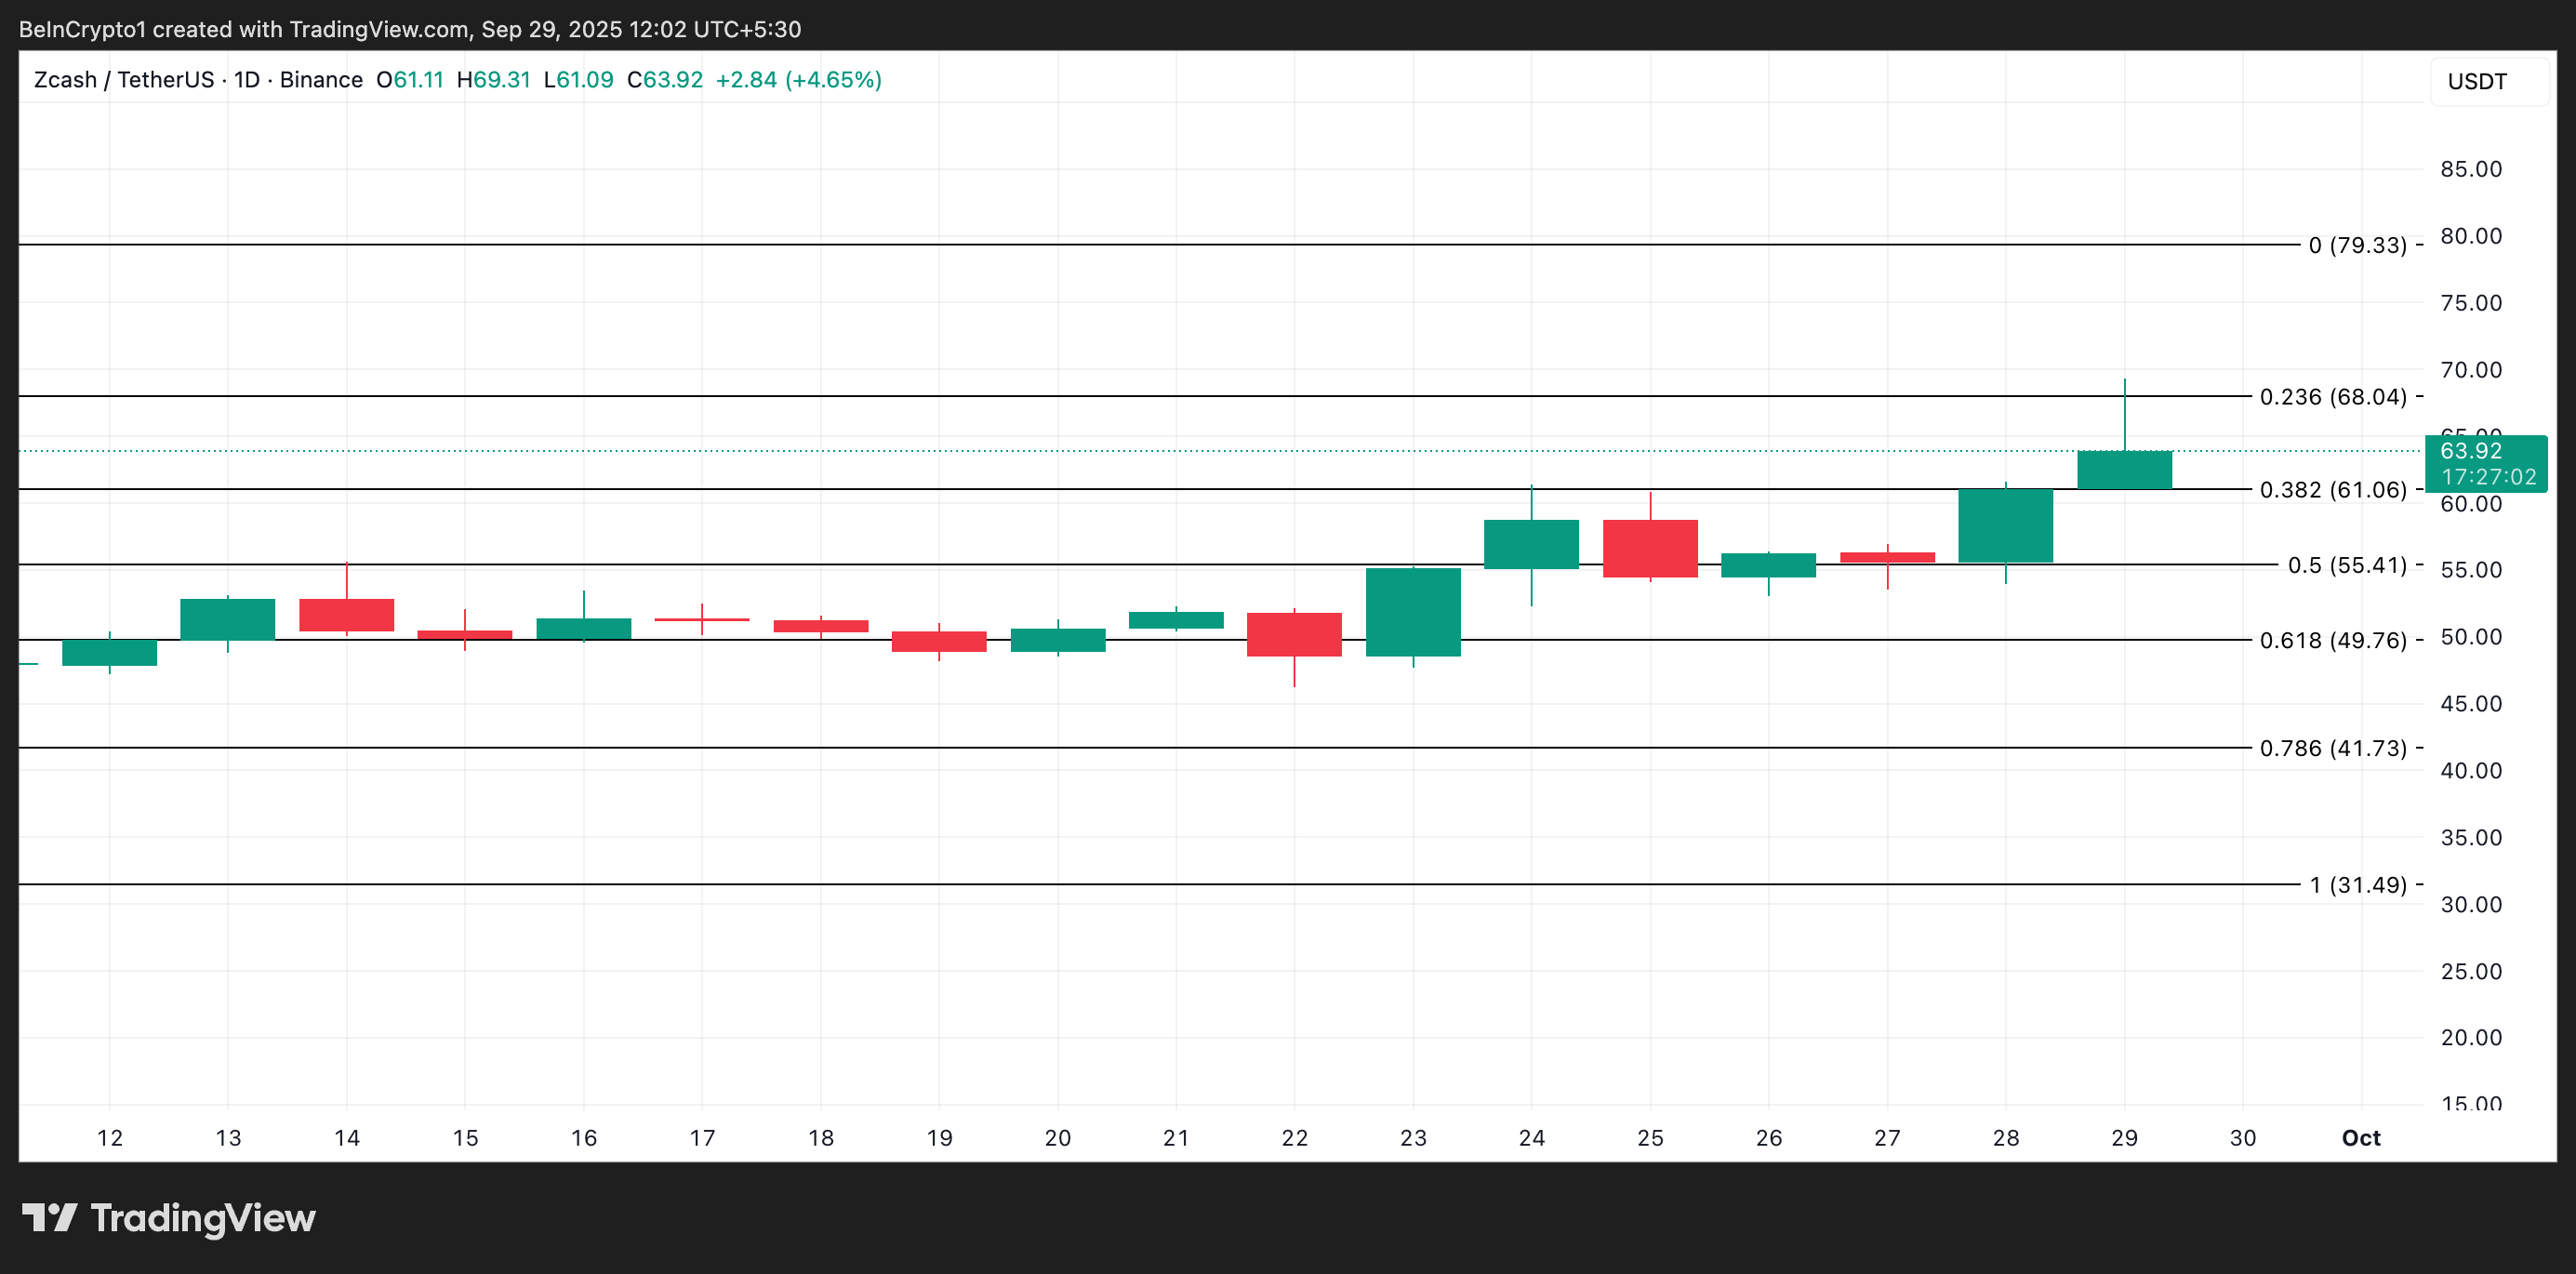
However, a rise in profit-taking activities could pose a threat to this bullish outlook. In the event of significant selloffs, ZEC risks losing its recent gains and may plunge below the support threshold of $61.06, which would signal a potential shift in market dynamics.
Given the data and indicators at hand, ZEC’s current position is a focal point for traders seeking opportunities in the altcoin market.